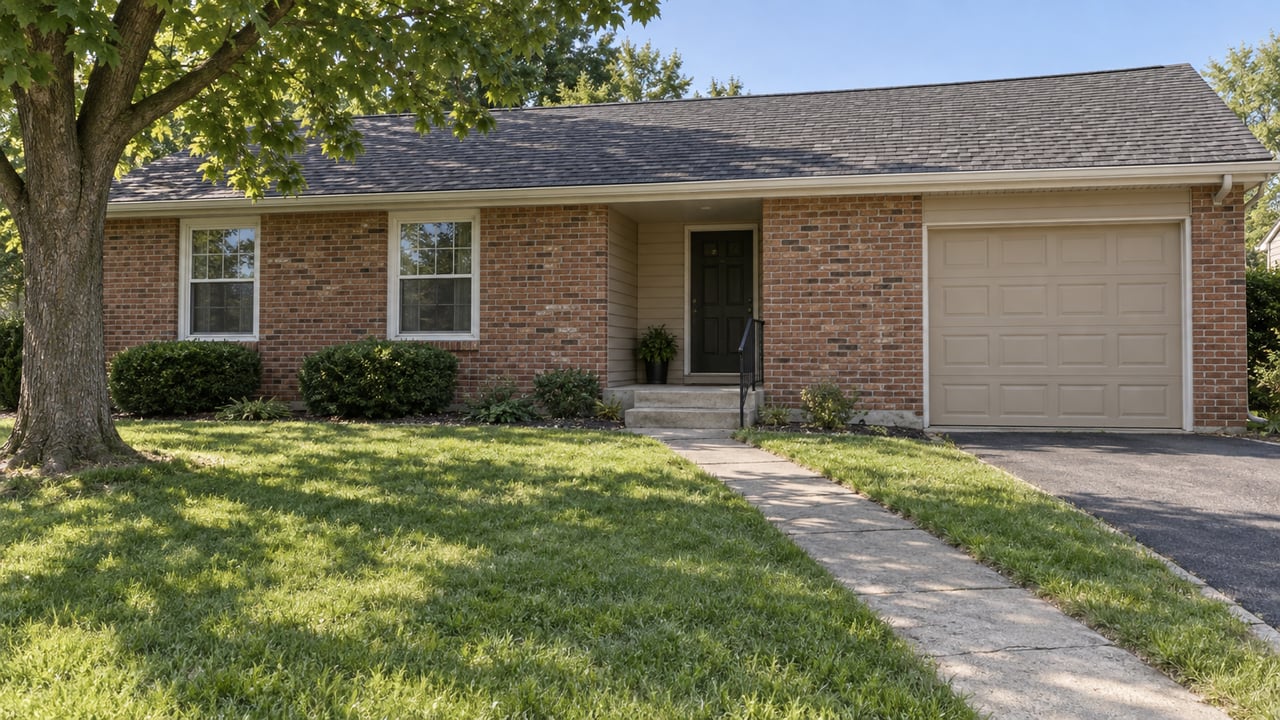
Look at Franklin's numbers by themselves and you'd guess the market cooled. As of June 2026, the median list price sat at $350,000, homes were spending a median of 63 days on the market, matching the same month a year earlier, and the price per square foot had fallen to $157, down about 11 percent from where it stood a year before. Flat price. Flat time on market. A double-digit drop in the one number that's supposed to tell you what a square foot of Franklin actually costs.
That combination doesn't happen in a market that's simply getting cheaper. If demand were softening across the board, days on market would stretch out too. It didn't. What changed is what's for sale, not what buyers are willing to pay for it. Franklin is running two housing markets under one median, and the mix between them shifted enough this year to drag the per-foot number down without moving anything else.
The Two Franklins Getting Averaged Together
Walk the blocks around Franklin College and the downtown square and you're in one market. Victorian homes, Craftsman bungalows, Cape Cods, and larger Colonials sit on small, established lots within a short walk of The Willard, Court Street Cafe, and Greek's Pizzeria & Tapp Room. There isn't more of this inventory coming. Nobody is subdividing a new lot on Main and Madison. Every one of these homes competes for buyers who specifically want that walk-to-downtown life, and scarcity keeps the price per square foot elevated even when the square footage itself is modest.
Drive ten minutes toward the U.S. 31 and I-65 corridor and you're in a different market entirely. Production builders are actively selling in masterplan communities like Kingsbridge, where floor plans such as the 3-Car Venture Collection put up considerably more square footage per home, often with community amenities and comparatively low HOA fees baked into the deal. A bigger home dividing into the same or even a lower total price produces a lower price per square foot by definition. That's not a discount. That's arithmetic.
Somewhere between those two is a third pocket: established neighborhoods like Club Estates near Hillview Golf Course, where midcentury ranches and larger single-family homes on mature, landscaped lots sit close enough to the golf course to hold value without chasing the scarcity premium of the historic core.
Here's roughly how those three pockets differ in what actually drives the number on the listing:
| Where | Typical Stock | What Actually Drives the Price |
|---|---|---|
| Downtown core near Franklin College | Victorians, Craftsman bungalows, Cape Cods, Colonials on small in-town lots | Walkable, non-replicable location near downtown businesses like The Willard and Court Street Cafe. Fixed supply keeps price per foot high. |
| Club Estates and similar established neighborhoods | Midcentury ranches, larger single-family homes on mature lots | Proximity to Hillview Golf Course and established landscaping support value without the scarcity premium of downtown. |
| Kingsbridge and other new subdivisions along U.S. 31 / I-65 | Larger new-construction plans like the 3-Car Venture Collection, on bigger lots with HOA amenities | More square footage per home, plus builder pricing and incentives, pulls the per-foot number down even as total price holds. |
When new-construction inventory in the third row makes up a bigger share of what's actually selling in a given month, the citywide median for price per square foot falls, even though nothing about the historic core or Club Estates changed at all.
The Same Shape Shows Up a County Over
This isn't a Franklin quirk. Zoom out to all of Johnson County and Redfin's data for the three months ending July 2026 shows median sale prices down 4.4 percent year over year to $328,000, with days on market rising to 28 from 19 a year earlier. If that were the whole story, you'd expect fewer homes changing hands. Instead, 289 homes sold that July, up from 238 the year before. More homes sold, at a lower typical price, taking a bit longer to close. That's what a market with more supply and more variety looks like. It's not a market buyers are avoiding.
Johnson County's own weekly MLS dashboard backs this up at a different snapshot in time. For the week of August 3, 2026, the countywide median listing price was $314,900, with a median 25 days on market. Different week, different exact number, same underlying pattern: prices moving around while transaction volume holds up or grows.
Franklin's price-per-square-foot dip fits inside that county-level pattern instead of standing apart from it. More new-construction product is reaching the market across Johnson County generally, and Franklin's version of that story happens to be concentrated along the U.S. 31 corridor.
Comparing Franklin to Greenwood Without Getting Fooled by It
Buyers cross-shopping Franklin against Greenwood run into the same averaging problem, just at a bigger scale. Current listing data puts Franklin's median in the low $300,000s, roughly 10 percent below Greenwood, with property taxes also running lower than in many surrounding areas. Greenwood's own numbers, meanwhile, show an average home value of about $319,732 as of July 2026, up 1.1 percent over the year, while Movoto's September 2026 figures put Greenwood's median list price at $382,000 and its price per square foot at $166.
That 10 percent gap between Franklin and Greenwood is real, but it only holds if you're comparing like to like. If you're pricing new construction in Kingsbridge against new construction in a comparable Greenwood subdivision, the discount is genuine and worth factoring into a budget. If you're comparing a downtown Franklin bungalow to a comparable home in Old Town Greenwood, the citywide medians on both sides stop being useful, because you're no longer pricing an average market against an average market. You're pricing two small, scarce, non-replicable pockets of inventory against each other, and neither city's overall median describes what's actually happening on those particular blocks.
The Line Item That Doesn't Show Up in the Headline Number
The gap between Franklin's two submarkets isn't only about the sticker price. Newer subdivisions along U.S. 31 tend to carry low HOA fees bundled with amenities, while the historic core generally has no HOA to speak of but comes with older systems and, in some cases, higher near-term maintenance. Property taxes in Franklin run lower than in many surrounding communities overall, but the specific rate still depends on the taxing district your address falls into, and that can shift meaningfully between a downtown parcel and a newer subdivision annexed more recently.
None of that shows up in a Zillow value estimate or a Movoto median. It shows up in the actual monthly payment once insurance, HOA dues, and the property tax line are added to principal and interest, and it's exactly the kind of detail that separates a good comparison from a misleading one.
If you're weighing a walk-to-downtown bungalow against a new build off U.S. 31, the honest way to compare them isn't the citywide median price per square foot. It's what each specific property actually costs to carry, month to month, once every line item is on the table. I've walked buyers through that exact comparison more than once this year, and it's rarely as simple as the portal numbers make it look.
If you want a straight answer on what a specific Franklin address, whether downtown or off U.S. 31, actually pencils out to, I'm happy to run it with you. Reach out to Angi Oakes and let's look at the real numbers together before you fall for a median that isn't telling you the whole story.